How Do I Track All My Investments in One Place? A Complete Guide to Unified Portfolio Tracking
Stop relying on spreadsheets. Learn how to track all your investments, public and private, in one place using automated, real-time aggregation for true portfolio visibility.

As wealth accumulates, the structure of an investment portfolio inevitably becomes more intricate. What starts as a single savings account and standard brokerage access evolves into a complex network comprised of multiple accounts and platforms.
Consider the typical expansion:
- A workplace pension or employer-sponsored retirement account retained from a previous employer
- High-yield savings maintained for liquidity management
- Venture capital investments allocated via private market platforms
- Digital assets secured in cryptocurrency wallets
This diversification reflects prudent portfolio construction but introduces a significant challenge: fragmentation. As assets diversify by provider and instrument, cohesive oversight is compromised. Providing an accurate response to a foundational question—“What’s my total net worth?”—becomes increasingly dependent on repetitive manual processes and multi-platform logins.
To move beyond superficial diversification, contemporary investors require integrated consolidation and precise systems.
Why Portfolios Become Fragmented Over Time
Portfolio fragmentation is seldom the result of a singular decision. Rather, it emerges organically as investors pursue optimal outcomes across disparate financial landscapes.
1. Specialization of Financial Institutions
Few, if any, financial institutions offer best-in-class solutions for every asset class.
- A legacy brokerage may provide superior equities research.
- Fintech platforms might deliver higher cash yields.
- Private credit, venture, or real estate investments may necessitate specialized platforms.
Each decision can be justified by its incremental value, but collectively, these choices generate a series of disconnected data sources, complicating comprehensive oversight.
2. Asset Class Expansion
As portfolios mature, investors routinely extend beyond public listings to incorporate private and alternative exposures—private equity, direct investments, non-traditional assets.
However, such assets are generally managed via separate infrastructures and lack standardized reporting or valuation protocols, further impeding aggregation efforts.
3. Life Events and Portfolio Transitions
Transformative events—such as succession planning, inheritances, or career transitions—frequently add additional accounts to the portfolio. For example, a spouse’s stock options, legacy pension vehicles, or inherited trust assets may contribute significant complexity.
The consequence is a portfolio with robust diversification and opportunity, but weakened by fragmented visibility and operational inefficiency.
How Investors Typically Try to Track Everything
As the administrative burden escalates, most investors seek out manual solutions to restore order.
1. Spreadsheets
Initial efforts almost always center on Excel or Google Sheets.
- Pros: Customizable and familiar.
- Cons: Heavily reliant on manual input, susceptible to error, incapable of providing real-time insights.
Such spreadsheets may suffice for a compact set of holdings, but rapidly become an operational liability as assets expand.
2. Basic Aggregation or Budgeting Apps
Consumer-facing aggregation tools employ API integrations to consolidate select bank and brokerage account data. However, these tools are typically designed with a focus on spend tracking and budgeting, rather than portfolio-level asset oversight.
Support for illiquid or private holdings is generally absent, resulting in persistent blind spots for users seeking full portfolio transparency.
3. Custom Dashboards and DIY Business Intelligence
Sophisticated investors may attempt advanced dashboards via platforms like Tableau, Power BI, or Google Data Studio, synthesizing exported data from various accounts. While this approach increases customizability, it imposes considerable operational load and requires ongoing technical oversight, ultimately limiting scalability and data reliability.
Three Data Levels Every Tracking System Must Address
Not every asset can be tracked the same way. Establishing realistic expectations for automation depends on understanding the three levels at which portfolio data enters a tracking system.
1. Provider-level (automatic)
Data is delivered continuously via authenticated integrations with banks, brokers, and pension providers. This category includes ISK accounts, depot accounts, pension vehicles, and standard brokerage relationships. With well-engineered connections—Findex maintains direct integrations across 50+ Nordic providers—these positions update without manual intervention.
2. Ticker-level (semi-automatic)
Market data updates automatically, but the underlying transaction record is supplied by the investor. This category includes listed equities, funds, ETFs, publicly traded bonds, and listed crypto. The valuation refreshes with the market; the cost basis and holding history remain investor-maintained.
3. Manual-level (fully investor-supplied)
No automatic market feed exists for the underlying instrument. The investor enters and revises the valuation directly. This category covers real estate, unlisted equity, art, collectibles, unlisted debt, and private loans.
A complete portfolio view almost always includes all three levels. Automatic provider connections handle most of the volume; manual entries usually carry the largest and most strategically significant assets. A system that supports only the first two levels remains structurally incomplete.
Why Manual Tracking Systems Always Fail
Manual processes may address short-term reporting needs, but fail fundamentally as asset bases and account complexity increase.
1. Data Decay and Latency
Financial markets operate in real time, whereas spreadsheets reflect discrete, static data points. Updates are inherently lagging indicators. A material change in asset values—such as a 10% market correction—renders manual tracking immediately obsolete and misaligned with actual risk and liquidity.
2. Human Error and Oversight
Manual data entry is inherently prone to error. Even minor inaccuracies—a misplaced decimal, a transposed figure—can cascade through allocation and valuation calculations. In addition, corporate actions or periodic events (splits, reallocations, capital calls) are frequently omitted or incorrectly registered over time, undermining data integrity.
3. Blind Spots in Aggregation Apps
Consumer financial tools frequently cannot reconcile complex instruments:
- Private equity commitments may be miscoded as simple cash outflows.
- Multi-currency accounts may generate inaccurate translations.
- Key portfolio nuances—vesting schedules, tax lots, undrawn commitments—are routinely ignored.
This creates notable blind spots and an incomplete basis for informed risk and return analysis.
4. Hidden Behavioural and Cost Drag
The most underestimated failure mode of manual systems is not arithmetic—it is decision quality.
Cognitive overhead. Maintaining a portfolio across four institutions, three currencies, and two asset classes in working memory leaves investors operating from approximations rather than precise figures. Decisions made from approximations tend to be miscalibrated against the underlying reality.
Concealed concentration risk. When a position is held across multiple accounts, its true weight is invisible at the account level. A 40% single-stock allocation distributed across three ISKs and a depot can read as a series of modest positions. The concentration risk is real; the visibility is not.
Fee drag and structural inefficiencies. Costs embedded across separate accounts—fund fees on substantively duplicate exposures, redundant platform charges, tax-inefficient account structures—are difficult to detect when each account is reviewed in isolation. Aggregation makes these costs visible and, by extension, addressable.
These second-order effects compound over time. The financial drag is rarely catastrophic in any single year, but is consistently larger than investors estimate.
What “Tracking in One Place” Really Means
Centralization must represent more than consolidated account totals. It requires a unified, analytically robust source of truth.
1. Data Normalization
Each asset adheres to distinct reporting conventions:
- Crypto assets are typically denominated in tokens.
- Private investments carry unique performance metrics and accounting structures.
- Brokerage assets utilize market valuations in fiat currencies.
An effective unified view employs normalization, converting all positions to a common analytical standard, and facilitating meaningful cross-asset and cross-platform reporting.
2. Cross-Asset Analysis
Advanced systematization enables multi-dimensional analysis, such as:
- Cumulative technology sector exposure, incorporating both public and private holdings
- Sensitivity analyses for interest rate changes, encompassing debt and real assets
- Liquidity forecasting to anticipate capital requirements and deployable resources
This level of systematic clarity upgrades oversight from account monitoring to comprehensive portfolio governance.
Bridging the Gap Between Public and Private Assets
The integration of public and private assets within a single dashboard is critical for a complete and actionable investment overview. Oversight that excludes private market holdings—now a material allocation for many sophisticated investors—provides an incomplete and potentially risky picture.
Tracking Private Assets Requires:
- Historical valuations to monitor long-term performance
- Documentation tracking (partner agreements, tax forms, capital calls)
- Application of specialized metrics: IRR, DPI, MOIC
Only a solution that achieves parity between private and public asset management can provide authoritative portfolio intelligence.
Overlooking private asset integration is equivalent to operating with a substantial oversight deficit.
Illustrative Case: From Eight Account Logins to One Dashboard
Consider an investor with the following composition:
- ISK at Avanza (equities, funds)
- Depot at Nordnet (equities, ETFs)
- Savings account at SEB
- Pension fund at Folksam
- Bitcoin and Ethereum held on Coinbase
- A rental property in Stockholm
- Seed-stage equity in an early venture investment
- A mortgage attached to the rental property
Before consolidation, this investor manages six separate logins, a spreadsheet with one column per account, and a net worth estimate that drifts within a 5–15% margin of error. The allocation across asset classes is essentially invisible at the portfolio level.
After consolidation, all eight positions appear in a single dashboard, updated automatically where possible and supplemented manually where necessary. The previously invisible concentrations now surface immediately: the rental property accounts for 45% of total net worth, the digital asset position for a further 12%. Physical and alternative assets together represent more than half of a portfolio that the investor had mentally categorised as equity-oriented.
This is the foundational input every subsequent allocation decision depends on. The spreadsheet model could not surface it; the consolidated dashboard does.
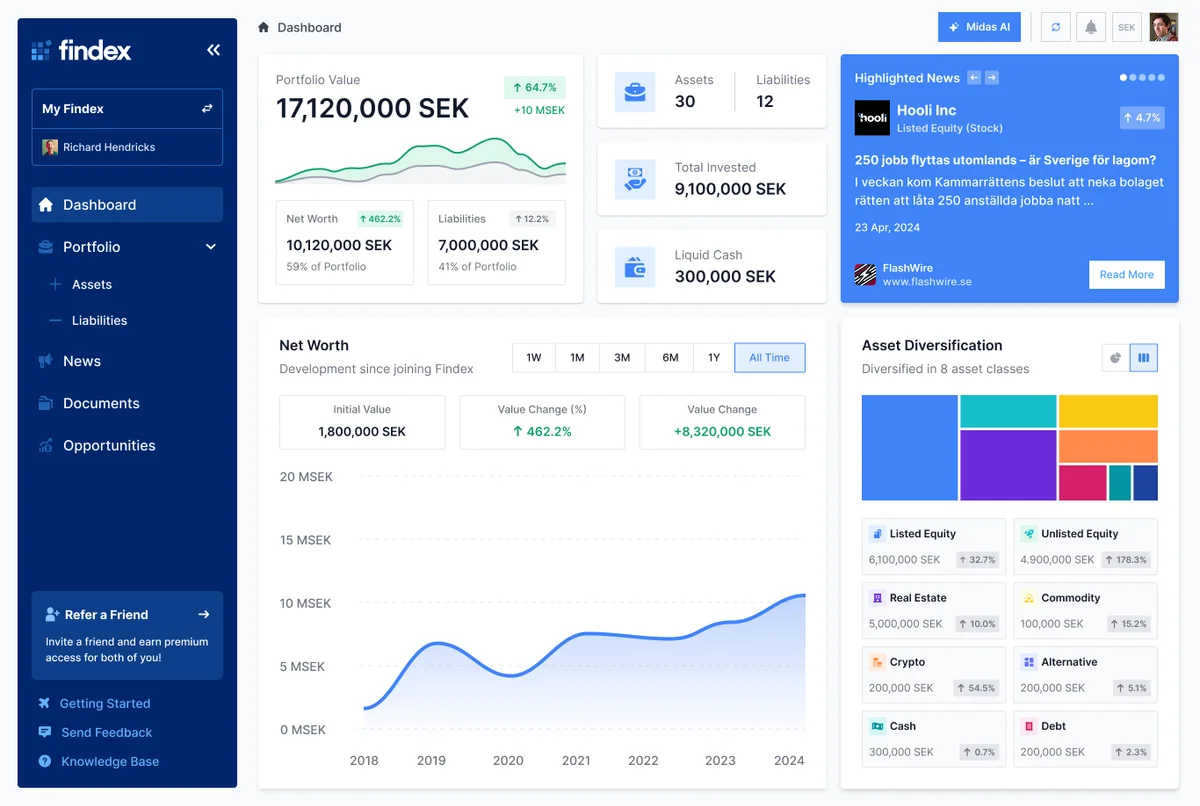
From Fragmentation to Clarity with Findex
Comprehensive investment oversight is not merely a matter of convenience. It is fundamental to operational control, accurate risk assessment, and capital allocation.
Findex provides a robust infrastructure to unify assets across all accounts, investment platforms, and custody solutions into a real-time, institutional-grade dashboard.
How Findex Delivers Control
- Automated aggregation: Complete data synchronization across banks, brokers, private funds, and wallets
- Continuous updates: Real-time visibility, eliminating manual intervention
- Data normalization: Cohesive reporting across asset class, provider, and currency
- Integrated analytics: Transparent analysis of performance, allocation, and risk exposures
Findex transforms ad hoc investment monitoring into a structured, resource-efficient governance tool suitable for complex portfolios.
👉 Track all your investments in one place with Findex to gain the operational control and data precision essential for informed decision-making.
What Portfolio Tracking Does Not Do
For clarity, the boundaries of portfolio tracking should be set explicitly.
Portfolio tracking is not financial advice. It is not active portfolio management. It does not generate buy, sell, or rebalance recommendations, and it does not assess whether your allocation is appropriate for your specific objectives or risk tolerance.
What it does is provide the complete, accurate, and continuously refreshed picture on which every subsequent decision—whether made independently, with an advisor, or with the assistance of automated tools—can be based. Judgment remains the investor's domain. Visibility is the precondition.
A useful framing: you cannot manage what you cannot see. Tracking delivers the visibility. Every subsequent decision depends on it.
Frequently Asked Questions (FAQs)
1. Why is it hard to track investments across multiple platforms?
Platforms use incompatible formats, reporting standards, and update intervals, requiring automation to enable reliable aggregation.
2. Are spreadsheets reliable for tracking a portfolio?
Manual spreadsheets are serviceable for simple portfolios, but quickly become error-prone and ineffective as assets and complexity scale.
3. What’s the benefit of using an investment aggregation tool?
Such tools provide a consolidated, real-time view of your total net worth, current allocation, and risk exposure—across all financial institutions.
4. Can I track private investments alongside public assets?
Yes—provided the solution supports private market integrations, including tracking for metrics such as IRR or MOIC.
5. How does real-time tracking improve portfolio management?
It enables timely, data-driven adjustments to respond to market dynamics and investment opportunities as they arise.
6. Is my financial data secure when linked to an aggregator?
Platforms like Findex employ bank-grade encryption and establish read-only data connections to maintain robust data security and privacy.
7. Can I track unlisted equity, startup investments, or private company shares?
Yes. Unlisted equity is supported at the manual data level. Holdings are added with an investor-defined valuation, included in the consolidated portfolio view, and incorporated into net worth and allocation calculations.
8. How frequently does Findex refresh portfolio data?
Assets connected via Findex integrations—covering banks, brokers, and pension providers—update on session open or via manual refresh. Listed securities update with ongoing market data. Manually entered positions are revised at the investor's discretion.
9. Is it secure to connect bank and broker accounts?
Findex uses read-only, non-custodial connections. The platform can view account data but cannot initiate transactions, move funds, or access credentials beyond the initial authentication step. All data is encrypted in transit and at rest.
Your complete net worth, finally in one place.
Join investors using Findex to consolidate, track, and grow their portfolios. One view of everything you own.
No payment information required.